(MAY 12)—Like most UP Diliman units, the UP School of Statistics (STAT) has projects addressing the challenges of the COVID-19 crisis.
Foremost is the Schools’ involvement in the UP Resilience Institute and the UP System’s UP COVID-19 Pandemic Response Team.
Outbreak threshold statistics. Prof. Peter Julian Cayton, PhD and instructor Jan Gil Sarmiento provided relevant monitoring statistics on the pandemic for the UP COVID-19 Pandemic Response Team’s outbreak threshold methodology. Using the number of active cases and the estimated threshold of an outbreak, they designed a recommendation rubric for the appropriate quarantine policy for a specific provincial or local government unit.
The outbreak threshold methodology is presented in more detail as a technical paper of Policy Note # 2 at the endcov.ph/advisories (https://drive.google.com/file/d/1p8104IyqUbmVjbP0_7YZBnRF6-9eFPQh/view).
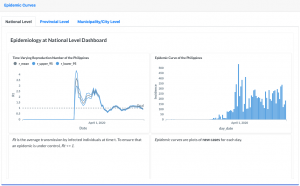
Rt and the epidemic curves. Cayton and Sarmiento also developed the methodology for solving the national, provincial and city or municipal level time-varying reproduction number or Rt and the epidemic curves.
The Rt is the average transmission of an epidemic, such as COVID-19, based on reported new cases. The epidemic curve is a graphical representation of the number of new cases. The Rt and epidemic curves are used to assess the efficiency of policy in reducing transmission within a community. Rt of less than 1 indicates a declining transmission while Rt greater than 1 means continued increase in transmission.
The statistics are accessible at https://endcov.ph/epidemic_curves and a technical paper on Rt is also presented in endcov.ph/advisories. The website contains vital information needed to fight COVID-19: the usual dashboard containing up-to-the-minute data on confirmed, recovered, and deceased cases; Suspect Cases and Probable Cases; number of persons tested; cases by sex, by age, by city (in the NCR). The website also provides a map view of the Philippines plus the country in the international scene, plus a complete list (with contact numbers and locations) of Philippine COVID-19 hospitals, all the COVID-19 policies issued by the government—general, health, economic, education, mobility.)
Daily book of statistics. Another project Cayton and Sarmiento are doing is the COVID-19 daily book of statistics with national, regional, provincial, and city/municipal levels of aggregation. This is a compendium or summarized COVID-19 statistics available at the Department of Health (DOH) website. It contains plots and numerical values for the following statistics: 1) the time-varying reproduction number (Rt); 2) the case fatality rate, adjusted for hospitalization-to death time; 3) recovery rate; 4) growth rates on confirmed case, recoveries, and deaths; 5) implied doubling times for confirmed cases, recoveries, and deaths; and cumulative plots of confirmed cases, actives cases, recoveries, and deaths. The statistics are publicly available and can be downloaded at www.facebook.com/pjacaytonphd, and in Twitter www.twitter.com/PJACaytonPhD.
The daily book of statistics has two volumes: Volume 1, Regions and Provinces; and Volume 2, Cities and Municipalities. The information from the compendium will be turned into a dashboard for wide access to users and policymakers.
LEADS 4 HSR Consortium. The duo is also part of the Leading Evidence-based Actions through Data Science for Health Security and Resilience [LEADS 4 HSR]. This is a consortium of public health specialists and data scientists against COVID-19 in the Philippines (https://www.facebook.com/LEADS.HSR/)
The Consortium is comprised of the Philippine Society of Public Health Physicians and academics from the Ateneo de Manila University, De La Salle University, University of the Philippines and partners from the private sector.
Cayton leads the team of Sarmiento, statistics consultant and data analyst Robert Neil Leong, and Dominic Ligot, founder and chief technology officer of CirroLytix Research Services, a social impact and data analytics company, (https://www.facebook.com/cirrolytix/) in designing the Time Varying R Dashboard.
The Time Varying R Dashboard features monitoring statistics and indicators on COVID-19, namely: 1) the time-varying reproduction number (Rt); 2) the case fatality rate, adjusted for hospitalization-to death time; 3) recovery rate; 4) growth rates on confirmed case, recoveries and deaths; 5) implied doubling times for confirmed cases, recoveries and deaths; and cumulative plots of confirmed cases, actives cases, recoveries and deaths.
The Dashboard is also featured in endcov.ph as an additional tab in the dashboard view. Future developments of the Dashboard will be localized versions for regions, provinces and cities or municipalities of the country for understanding the COVID-19 situation in the local level. The Dashboard is available at https://covid19.psphp.org/?page=tsr
Other initiatives. Meanwhile, former STAT dean Prof. Erniel Barrios, PhD provided strategies for mass testing by identifying the vulnerable segment and number of tests to be prioritized by the Quezon City government. Quezon City now has a “drive-through” style of testing in each district.
Barrios also co-authored a paper regarding validation protocol for an antibody test. The validation protocol aims to provide guidance for test kit manufacturers by facilitating the computation of sensitivity, specificity, false-positive and false-negative. The validation protocol is published as Philippine-American Academy of Science and Engineering (PAASE) Bulletin #16 at http://www.paase.org/.
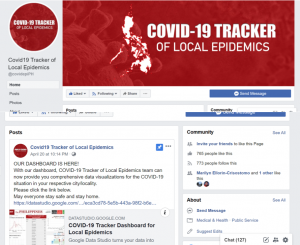
Presently, Barrios is developing a model for the computation of a province’s vulnerability index. Together with STAT graduate student Paolo Redondo and a group of epidemiologist from the UP College of Public Health, he developed the dashboard “COVID-19 Tracker of Local Epidemics” ( https://www.facebook.com/covidepiPH/). The dashboard provides comparative analysis of epidemiological dynamics among local government units. The team plans to establish a website soon.
STAT is also part of the UPD Supply Chain COVID-19 Response Task Force Committee. Professors Francisco de los Reyes, Manuel Albis, Charlene Mae Celoso, Stephen Jun Villejo, Cayton and Sarmiento provided computations and models relevant to the demand and supply of essential goods and services, economic stability in the agriculture sector and COVID-19 response framework. They also participated in crafting a survey instrument for the manufacturing industry.
Other faculty members are engaged in some exploratory analytical studies of data related to COVID-19 geared towards academic research or discussion papers.
STAT collected P59,500 from its faculty members in a donation drive for the school’s custodians, guards, and administrative aides. The amount was immediately distributed to six custodians, four security guards and three administrative aides while the UP Statistical Center Research Foundation, Inc. gave P50,000 to the School’s support staff.
As it works under the radar, STAT’s probability of public service for the nation’s welfare is indeed very high.


