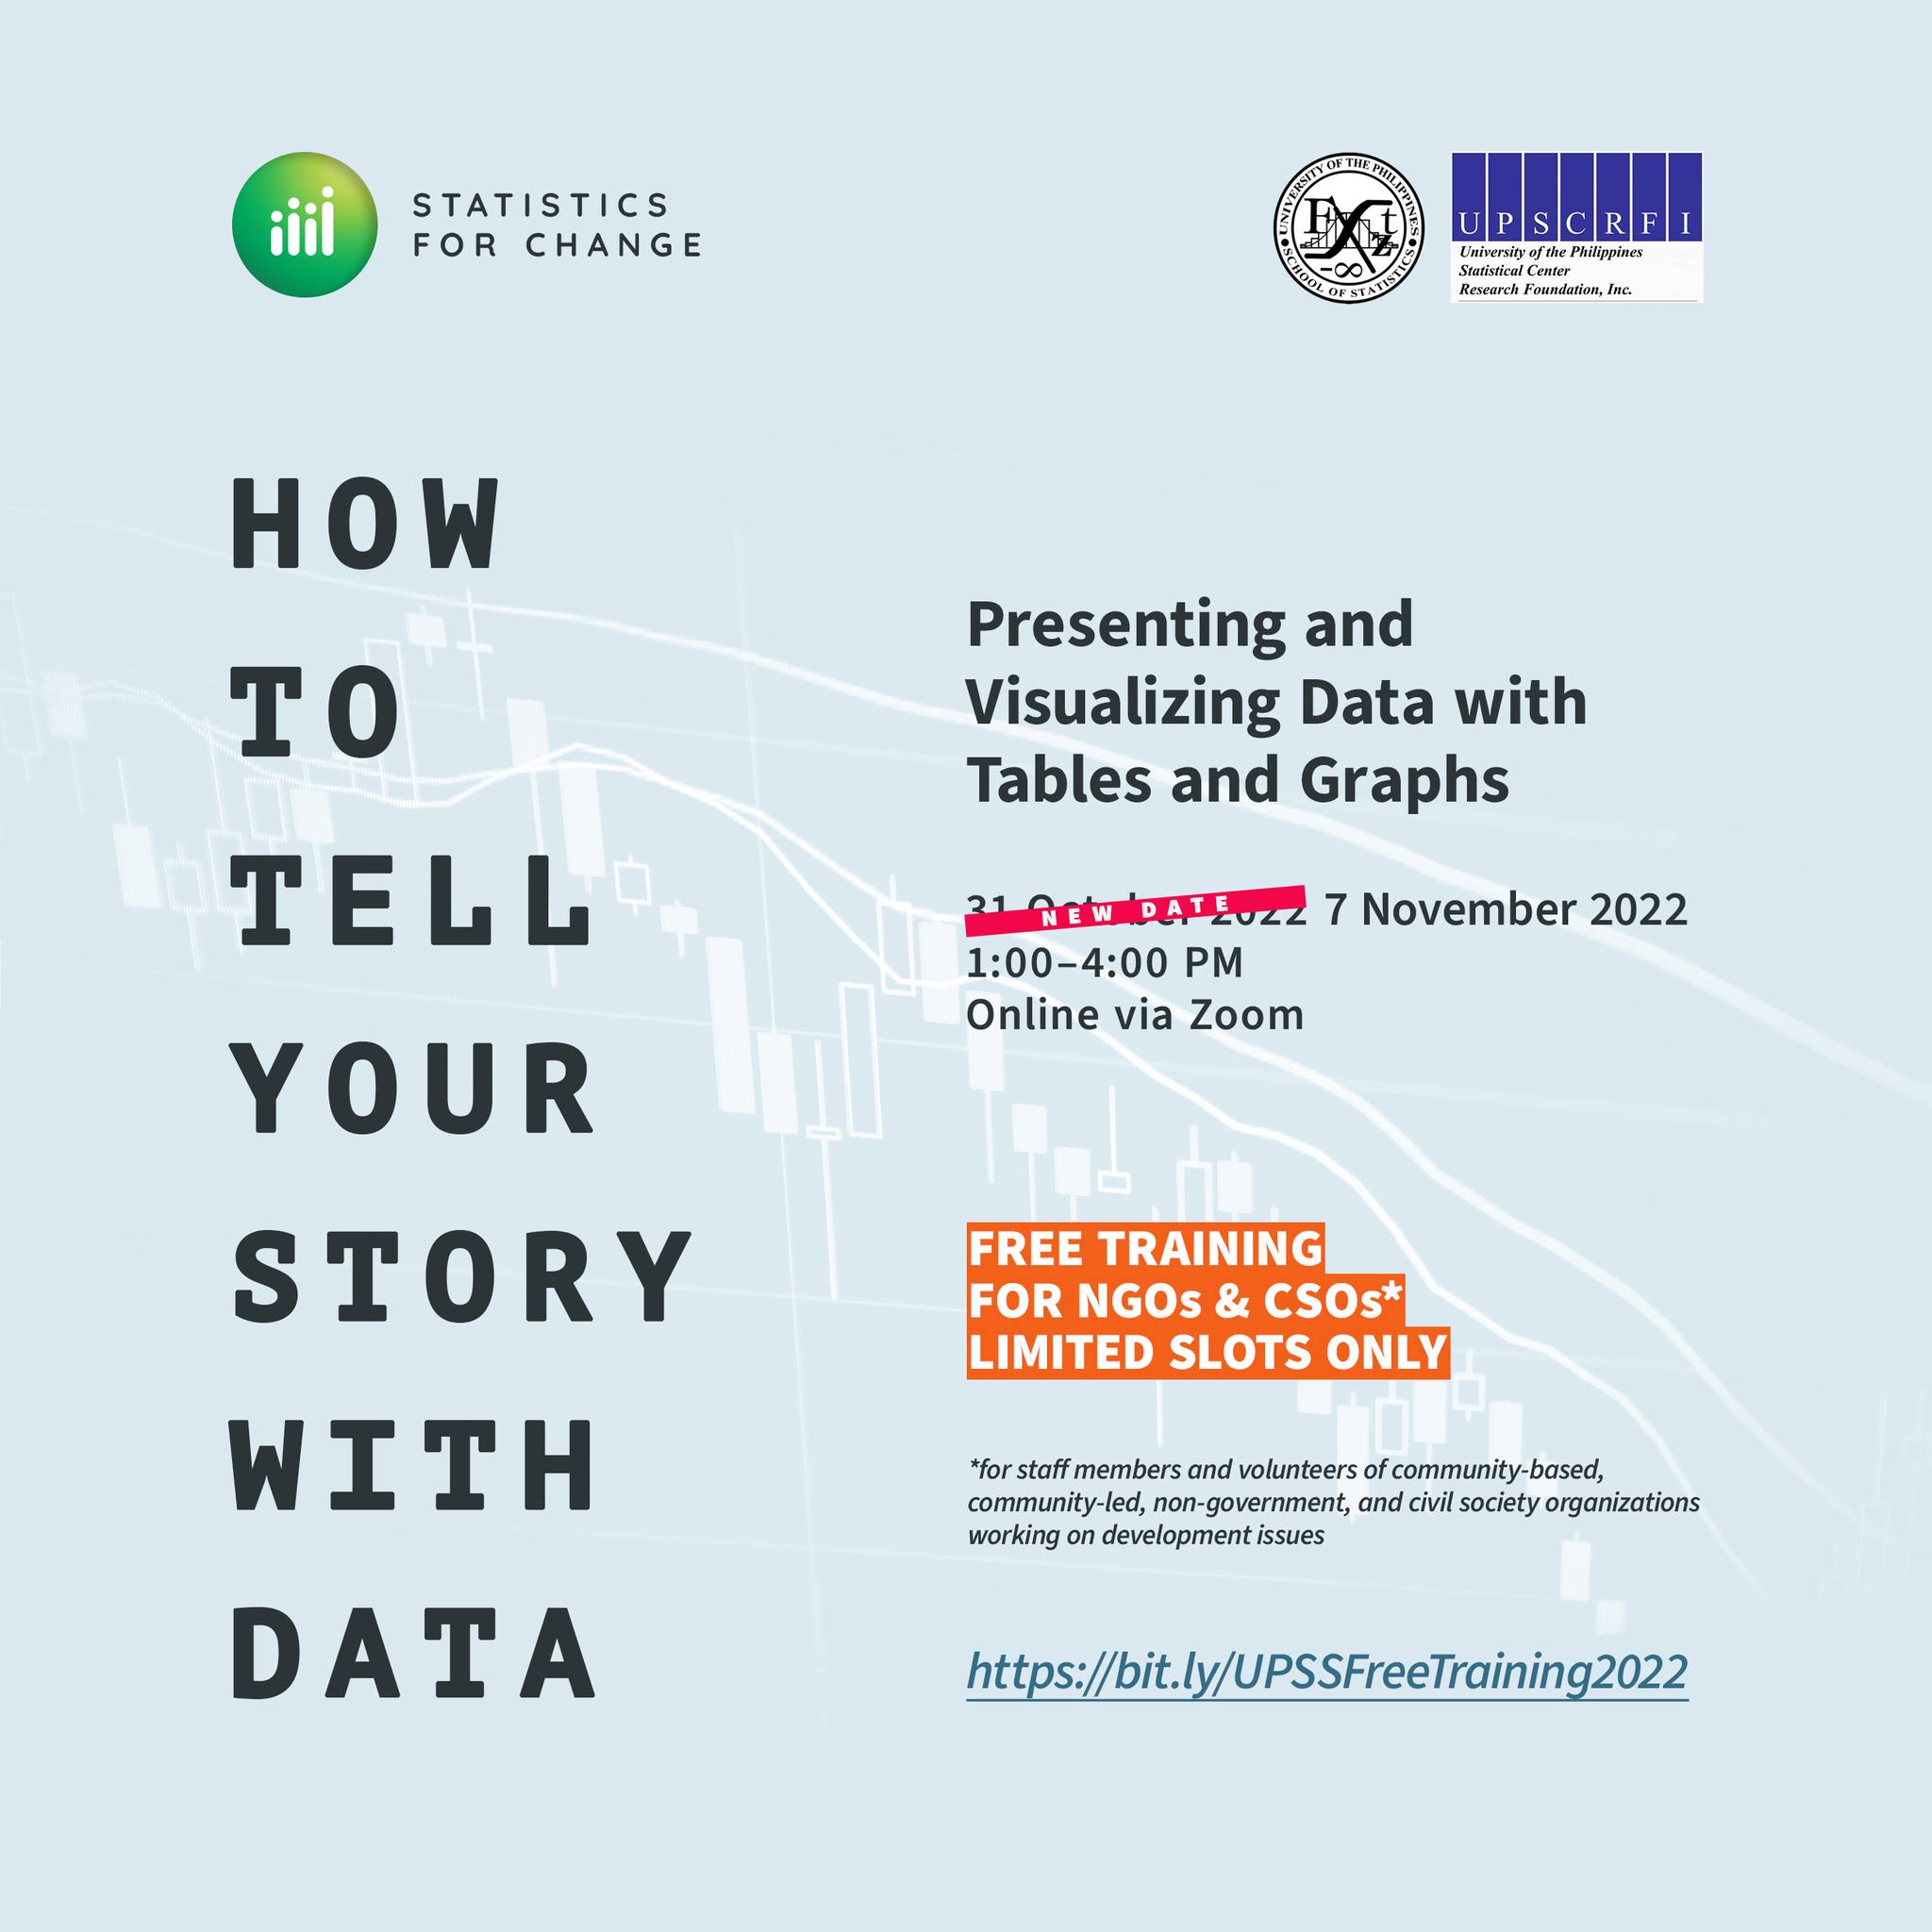


How to Tell Your Story with Data: Presenting and Visualizing Data with Tables and Graphs
Date: Nov 7 | 1:00 PM - 4:00 PMThe UP Diliman School of Statistics announced that the training “How to Tell Your Story with Data: Presenting and Visualizing Data with Tables and Graphs” which is supposed to be held on October 31 will be rescheduled to November 7, Monday, 1-4 p.m.
Interested participants may still register until October 28 at https://bit.ly/UPSSFreeTraining2022.
For more information, visit https://www.facebook.com/UPDStat/.